Air Spark aligns technologies and business processes to create solutions that enhance business performance through a digital transformation from legacy systems.
Data
Examining the data to gain deeper insight and make better real-time decisions a meaningful and profitable impact on the company.
The Data

Data
Visualization
Translating information into visual context to understand and pull insights to identify patterns, trends, and outliers in large data sets. Modern data visualization interfaces show the whole process from raw data to actionable data that business models can use to drive bold and competitive decisions.

The Visualization
Process
Converting raw data into a graphic format that shows correlations in the data and defines tendencies and patterns. Data visualization has become a standard way to introduce information through representation tools such as Power BI.
1
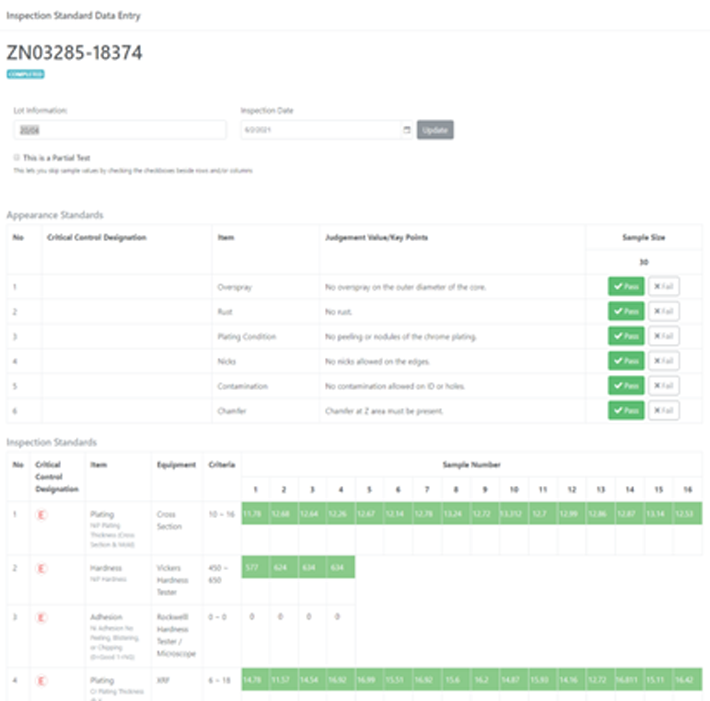
Data Sourcing
Identifiy the right problems to solve , which will determine the right data to source, track, and present. Asking the riht questions will lead to tracking the right data.
2
Extraction
Moving data from it's sources to the staging area where it can be analyzed, and begin conversion to digitized platforms.
3
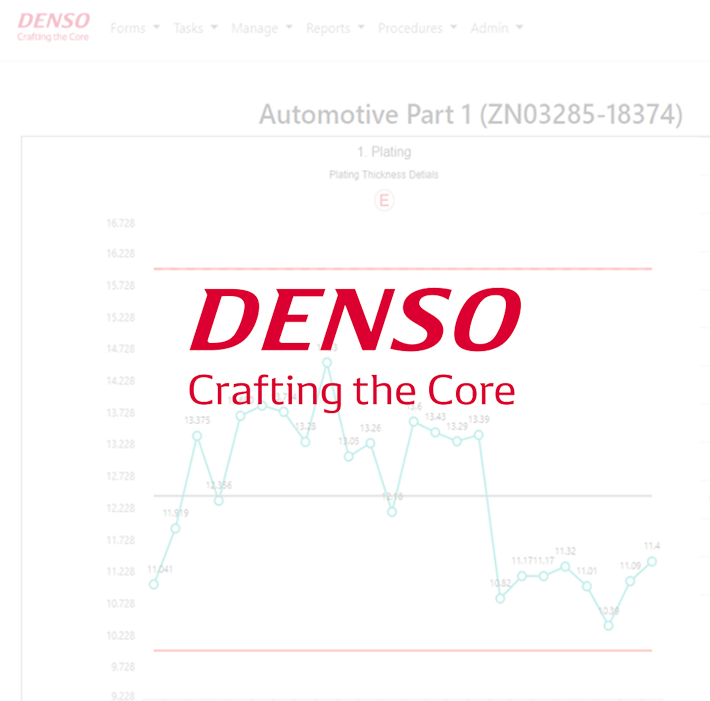
Data Transformation
Cleaning, standardizing, and fortmatting the data. Integrating digital technologies for agile data response and real-time data recall.
4
Loading
Uploading data-driven and integrated technologies and custom solutions that provide digital agility driving new innovations and providing new value in utilizing custom dashboards and reporting software.
5
Data Warehousing
Establishing a data management system custom designed to support business intelligence analytics. Query and analyze large data sets extracted from your data.
6
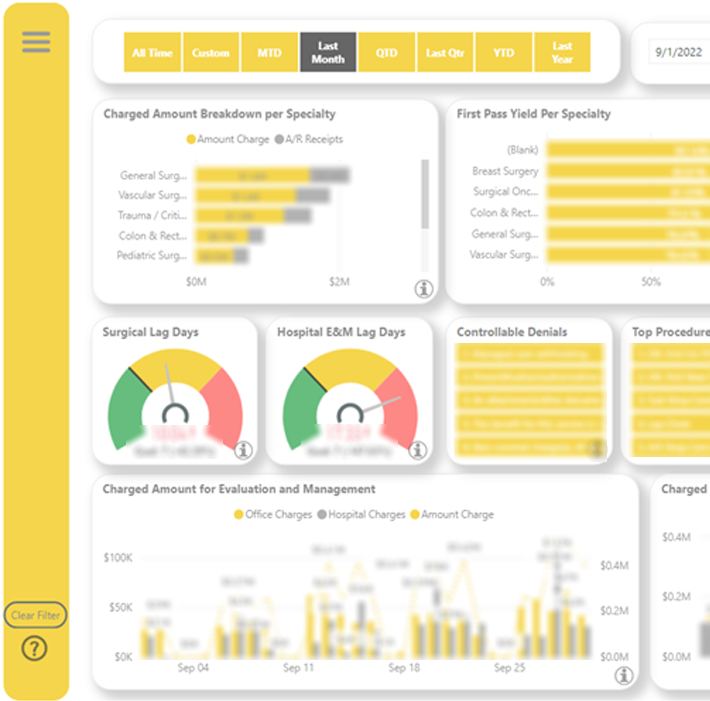
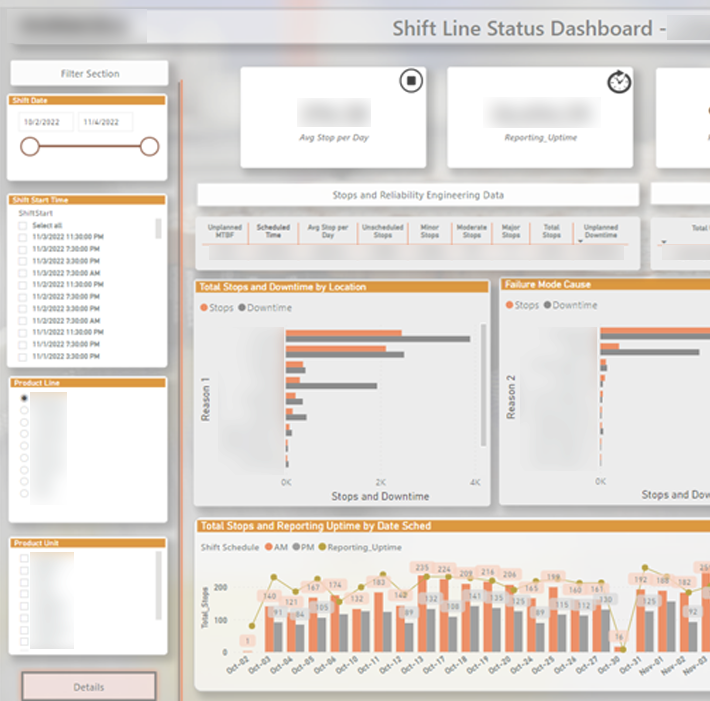
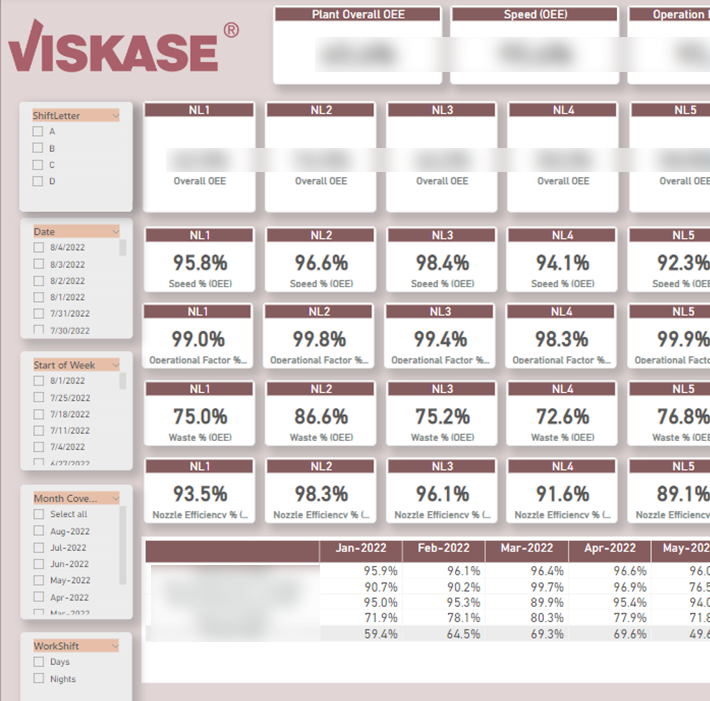
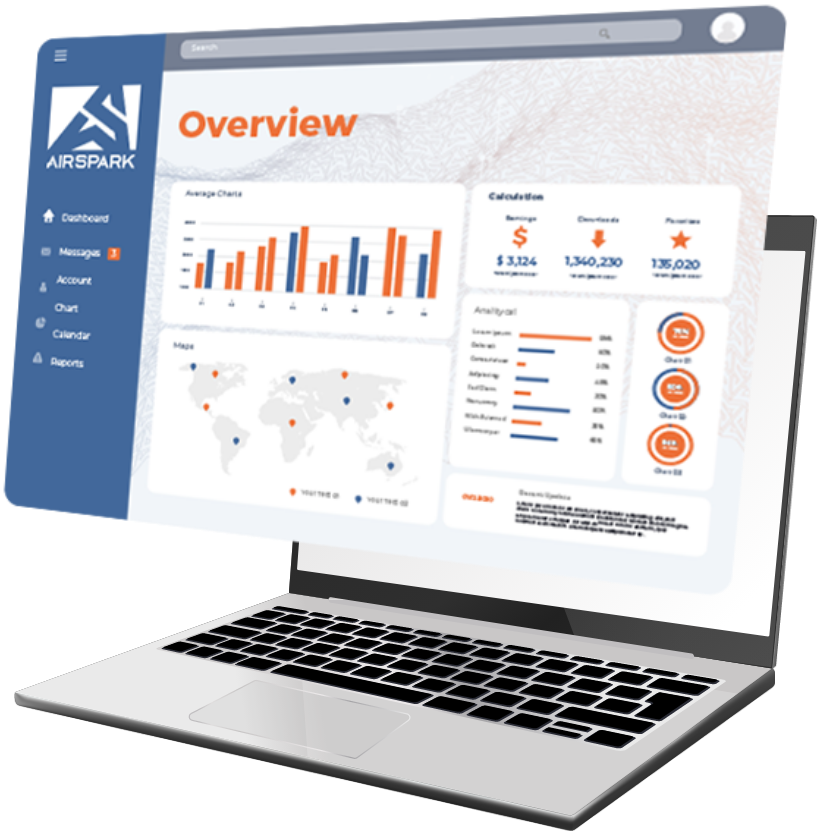
Interactive Dashboards
Drive business model innovation with custom integrated digital technologies and software crafted to show powerful graphic representations via highly interactive dashboards.
Data Visualization Tools
Visualization technology based on data-driven models makes poerful and dynamic dashboards ad custom software to establish and build a resilient data archetecture.
Learn MoreOur Portfolio
Latest Blog Post
Embracing Disruptive Technologies
Read Full Story >>
Disruptive Technologies can be defined as innovations that alter how customers, industries, and businesses operate. The disruption encompasses established rules, processes, and analog legacy systems to give way to technologies that revolutionize the way you think and use these technologies.
Power BI: The Power of Visualization
Read Full Story >>
Creating data-driven business intelligence for everyone at every level of the organization to visualize can be a powerful tool. Do you currently have the confidence to make up-to-the-minute data-driven analyses and decisions? Can you empower your company and employees to visualize any data on the business intelligence platform? Does your business intelligence platform help you […]

Contact Us
Let Air Spark build a resilient architecture for data collection and bold presentation through dynamic software and dashboards.
